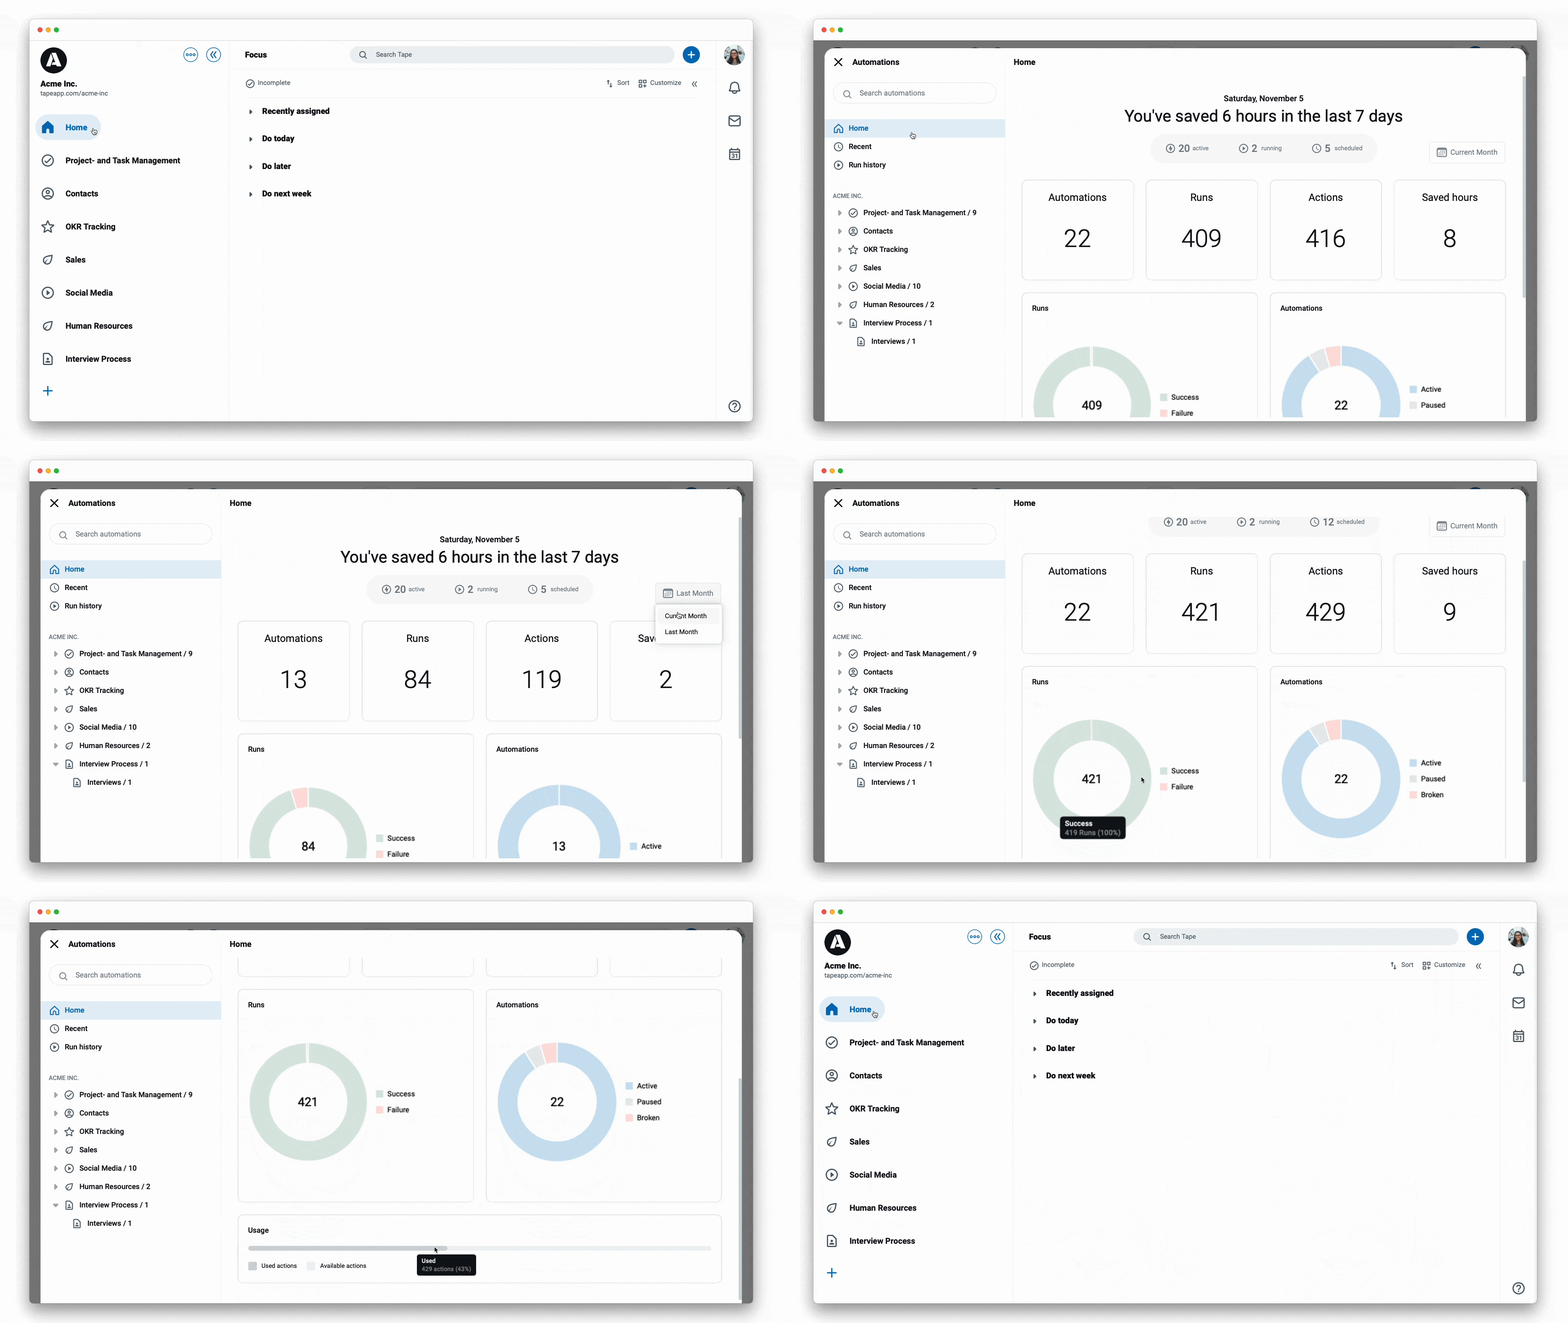
The Home page in the automation center gives you a great overview of important automation stats and live information. The graphs and visualizations let you quickly zoom out to instantly identify potential blockers and see what you’ve already achieved.

- Go to an app
- Click on the
...menu next to the app name - Tap on
Workflow automation - Click on
Home
Home page: a tour
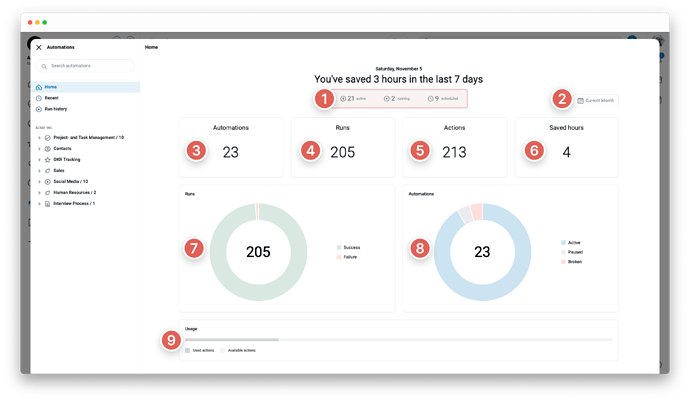
The charts will auto-populate when you first land on the tab and will automatically update every time you visit the tab or refresh the page, so you know the information is always up to date.
-
The current status of your automation
-
Switch between the current or last month’s data
-
Count of automation
-
Runs this month
-
Actions this month
-
Saved hours this month
-
Details of runs this month
-
Details of the current automation
-
Usage of actions this month across your organization
![]() An action is counted every time an automation successfully completes an action for you.
An action is counted every time an automation successfully completes an action for you.
Stay in the loop by tracking all automation runs in one place, learn more about the global run history →
