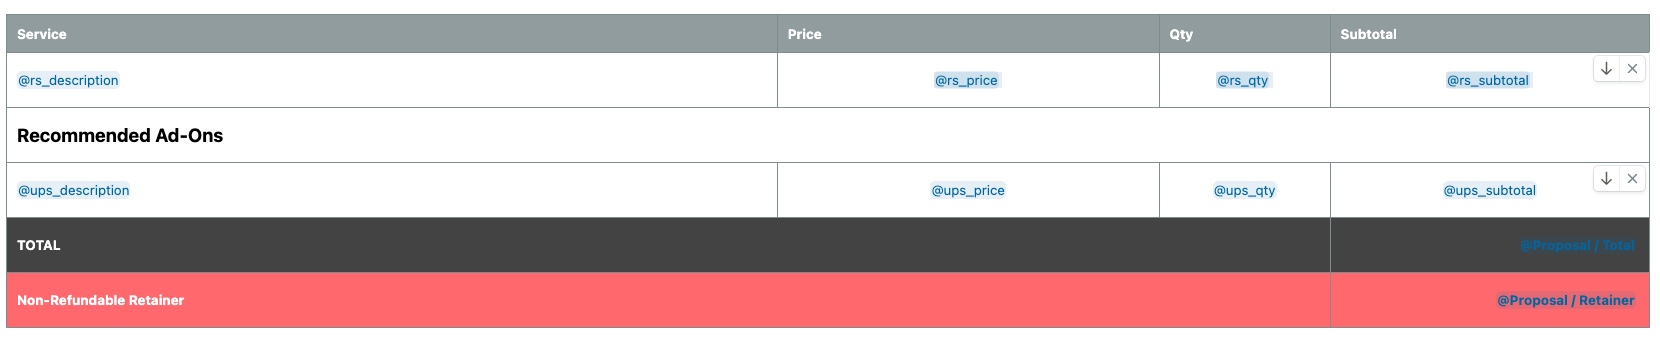
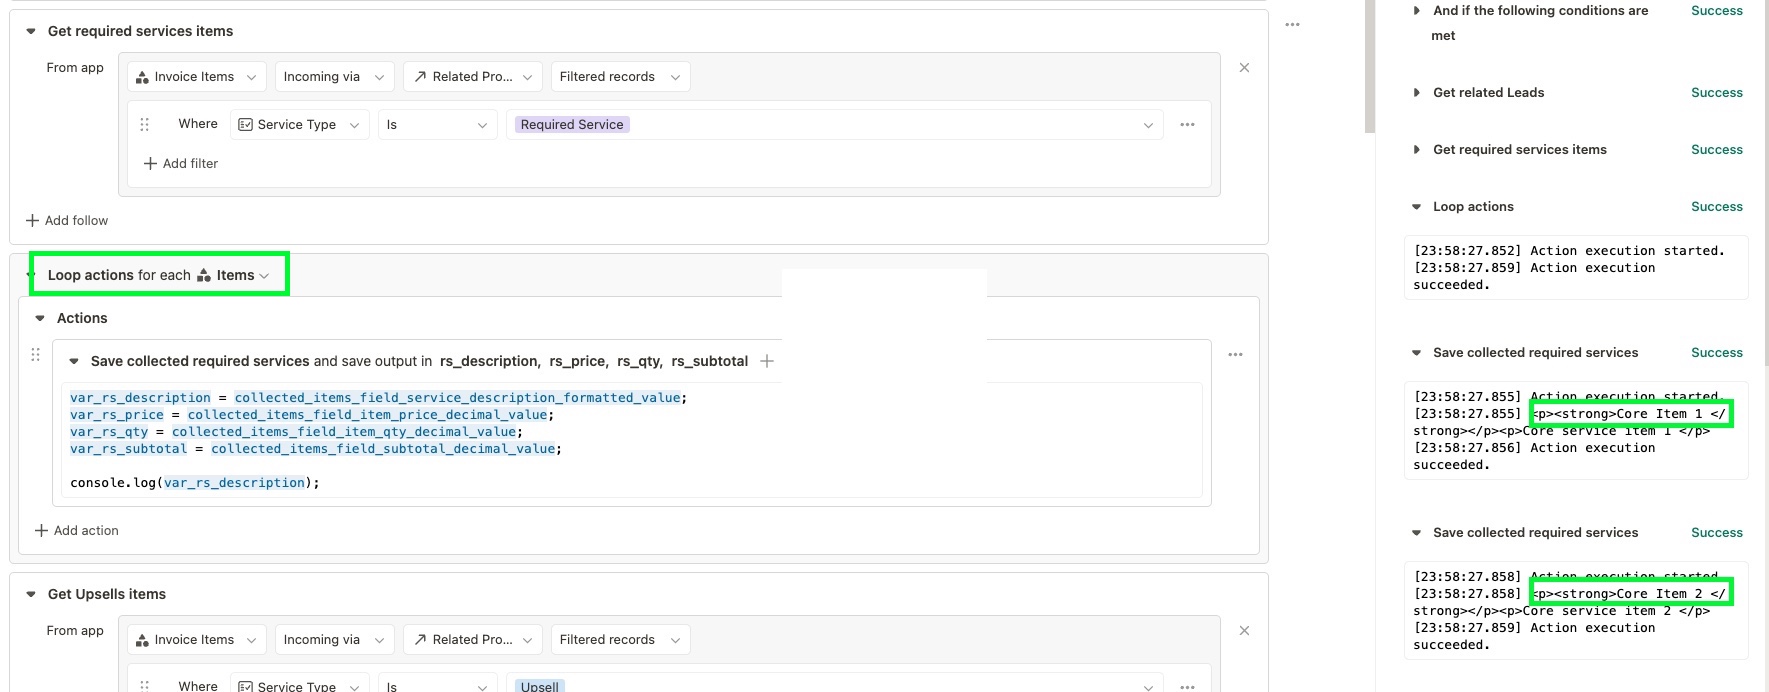
The first part contains the required services for the invoice. Below are the recommended Add-ons, which the user can change by updating an external form. To separate each section, I did the following:
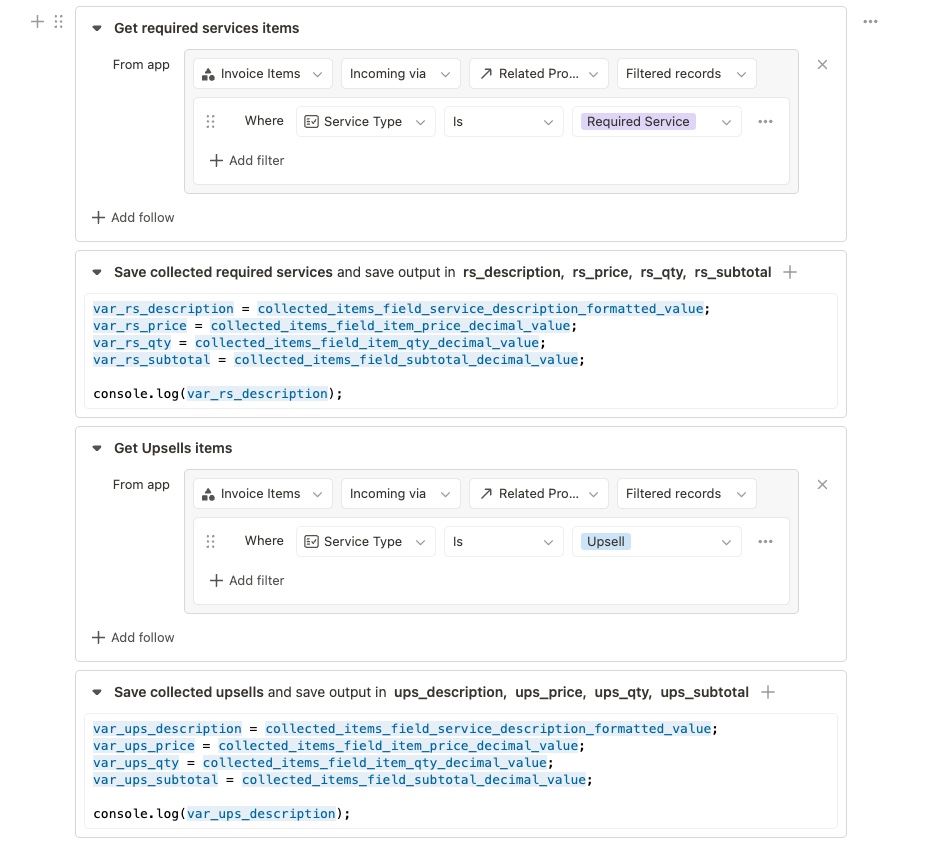
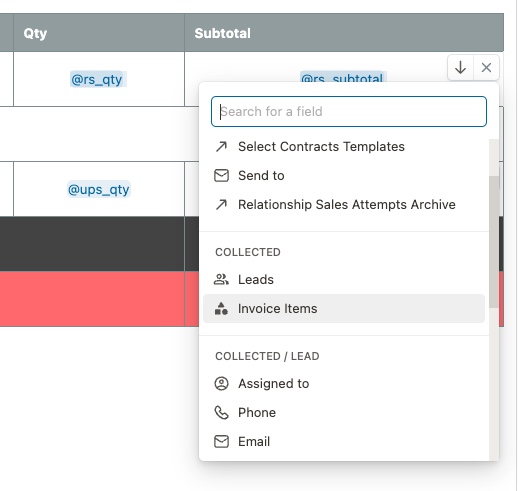
Each custom variable is added to the appropriate section of the table. On the “variable to change the row below,” I added collected “Invoice items,” which contain all the records categorized by required and upsells.
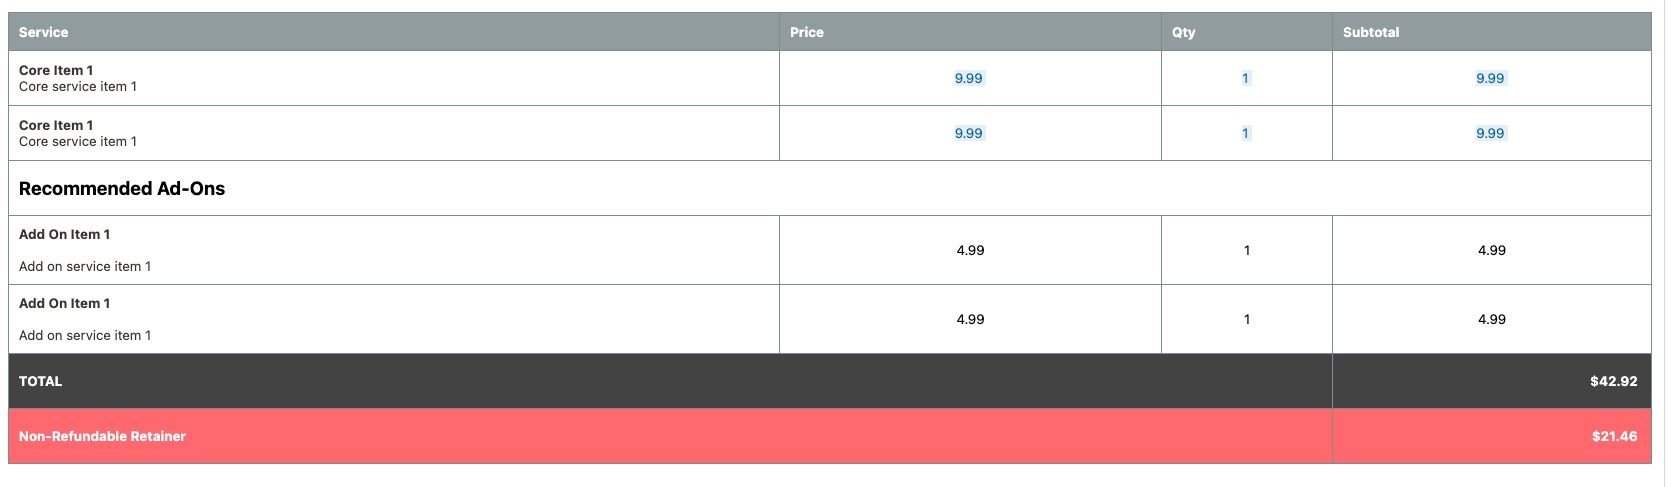
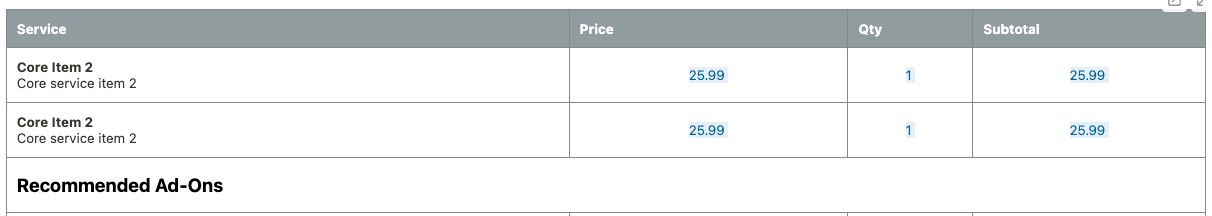
Although the variables show the collected data in the correct column of the table, I am encountering that when simulating the variable, it only inputs the first collected data and then duplicates the same thing on the next row. The example below is supposed to show “Core item 1”, “Core item 2”, “Add On Item 1” and "Add On Item 2. Instead, it only shows the first collected.
Hopefully, I explained well enough (the automation has many moving parts). Has anyone done something like this before? What do I need to do different to show all the collected data appropriately?
I am not sure how helpful I am going to be (a bit short on time) but I will give it a go:
At first glance I don’t think your loop one will work as if I am reading it correctly you are just replacing the variable in each loop rather than adding to the variable.
You say ‘simulate’ what happens when you run it for real, it seems to me that simulations in Tape are not true representations of what will happen in a real run. ︎ Check this first
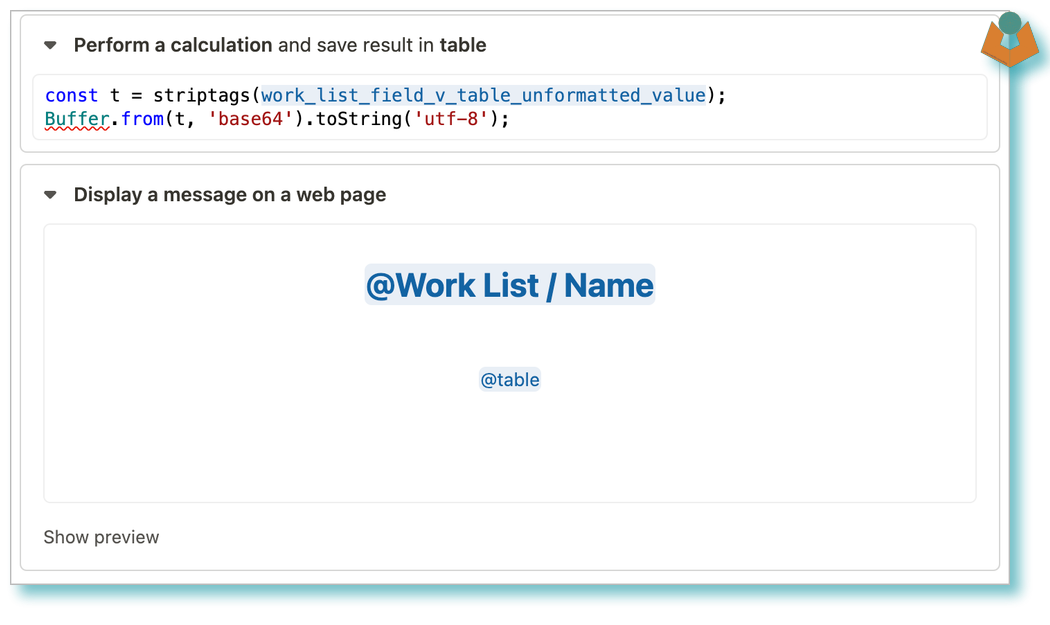
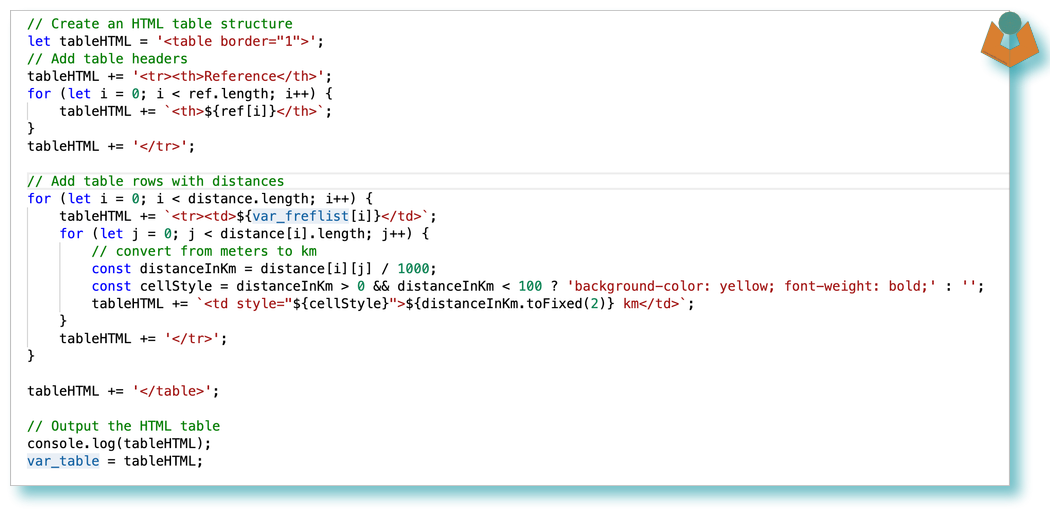
Have you considered building the Table separately and just adding the pre-built table:
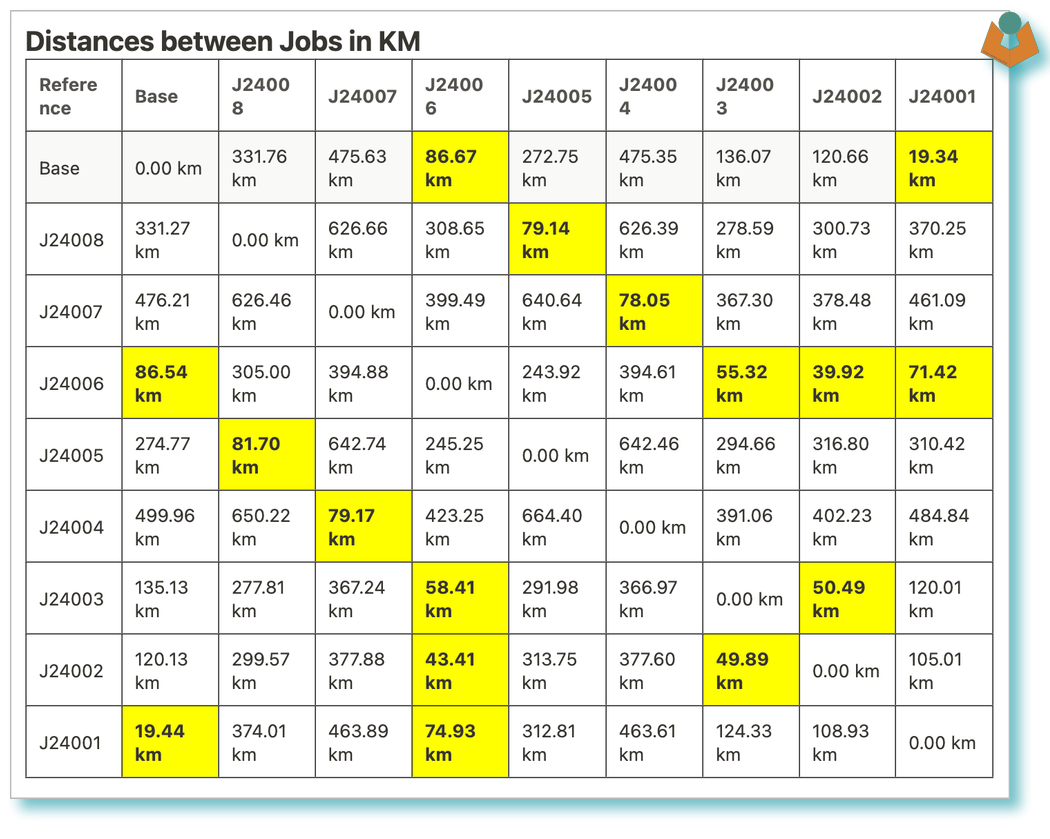
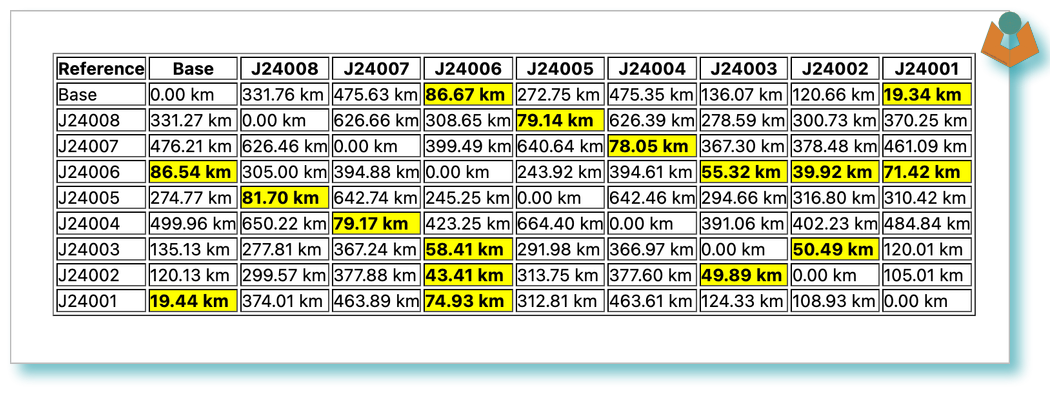
One I was working on yesterday:
in a record calculation field:
Both are from the same prebuilt HTML table with reasonably complex data collected from different places.
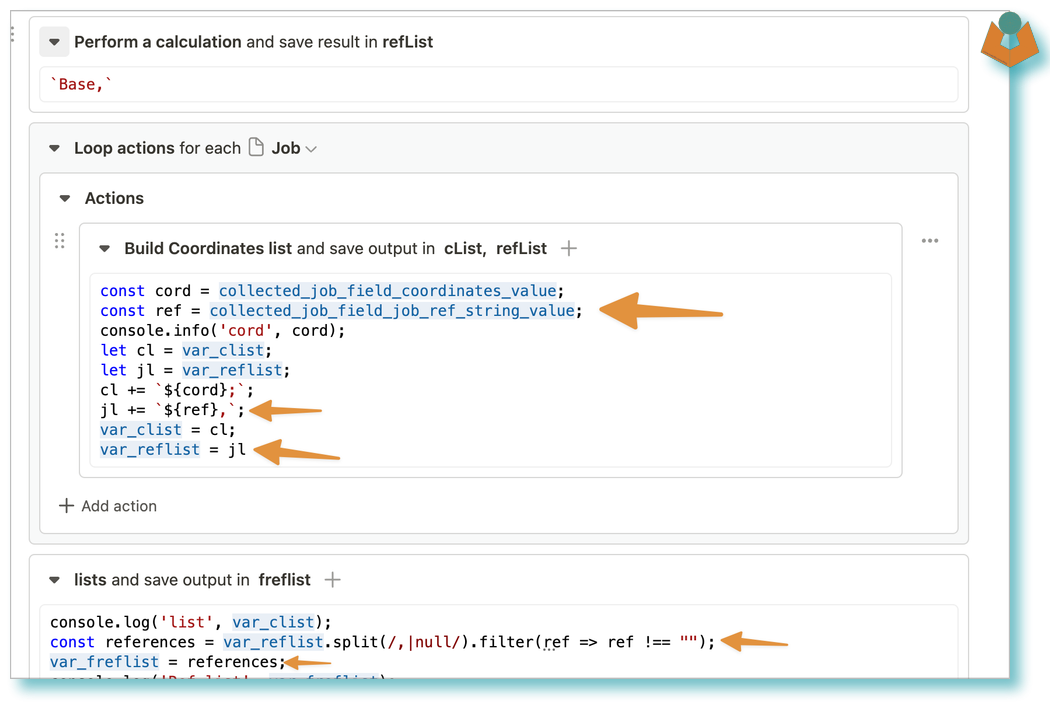
This shows building the data in a loop from collected records, it is doing other things as well so I have arrowed the bits that are similar to what you are doing
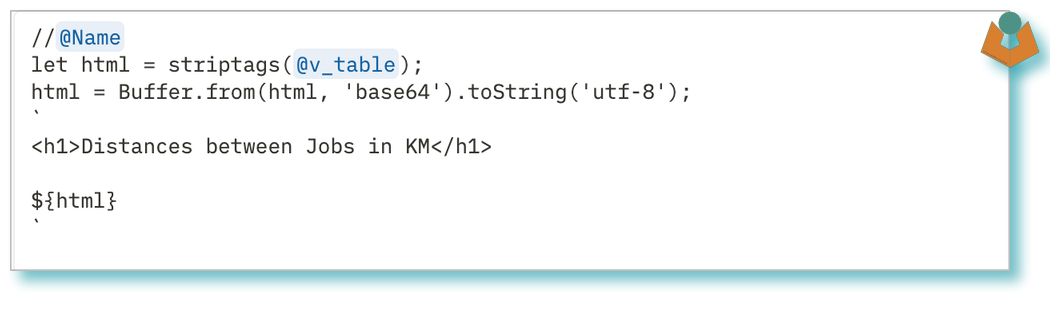
He builds the table in the calculation field from stored JSON where I store the table, he uses regex to clean up his JSON following being in a multiline field I have used base64 and striptags but the principles are the same.
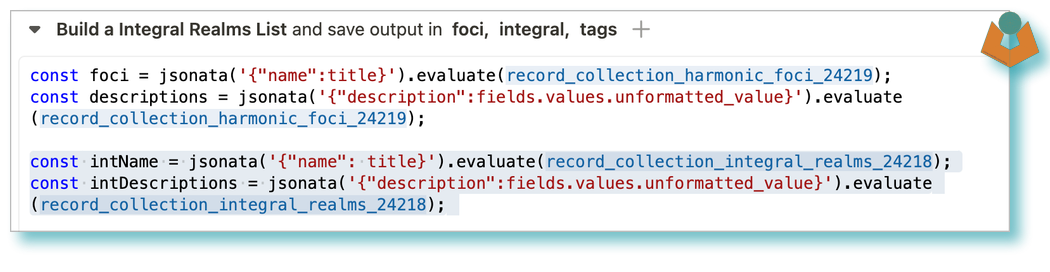
Also where you are trying to build your ‘list’ with a loop in my screenshots I show a way to do that however a different way to achieve a similar thing is but without the loop:
Hopefully, something in that lot can help you if not I know there are others around who have done more collections in PDF’s (which is the same principle as what you are doing). And before you do anything else try running the automation for real rather than as simulate variables to check if the results are different.